
Reporting on AutoQA Evaluations
Once evaluations are enabled and utilized, you'll be able to use the content of this article to access the results in a report
Evaluations must first be configured
To learn how to license agents and configure an evaluation, please review THIS ARTICLE
Report Customization RequiredThough we've roadmapped methods to make evaluation reports more automated in the future, we currently require a custom report to built to display desired evaluation results in a report.
Building a Custom Report
This article will not focus on how to build a custom report but rather the key steps to build reports focused on evaluations.To learn more about building a custom report, view the article here:
Step 1: "Select Row Type"
Choosing the correct report type
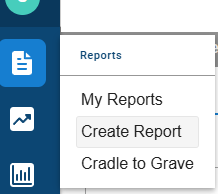
First start a new custom report:
Evaluation results can be reported in:
- Call level (detailed) reports
- Summarized reports (i.e. Skills per row, Agent per row, etc)
- Time Interval Reports (i.e. Days of the week per row)
If you're looking for a breakdown of all calls and their individual scores, consider a "Call" level report when asked to select a "Row Type" on the first page of a customer report
Step 2: "Define Row Filter" (Optional)
NOTE: This only applies to detailed reports. You'll see this if you selected "Call" as a row type on the previous screen.
You do not need to define a filter for the report but you may choose to do so if you want to limit the report to only list a certain type of call. A prime example of a filter you may choose is to only display calls that have been scored.
To accomplish this, add a new criteria and search for "Is Scored" and select the option:
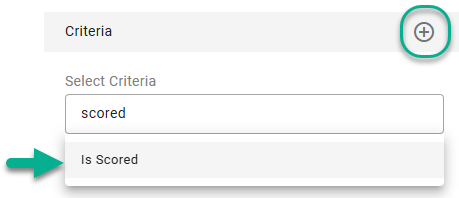
Next, select "Yes".
You may add additional filters if you desire but they are also optional.
Select "Save Filters" when done
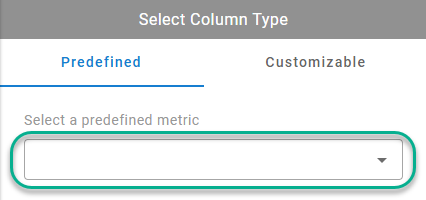
Step 3: "Select Column Type" (adding columns)
Note that you are not limited to evaluation-based metrics in this report. You may add any column made available to you in the metric selector.
To find all available evaluation metrics for this report type, click on "Select a predefined metric" and you'll see the Metric Selector menu.
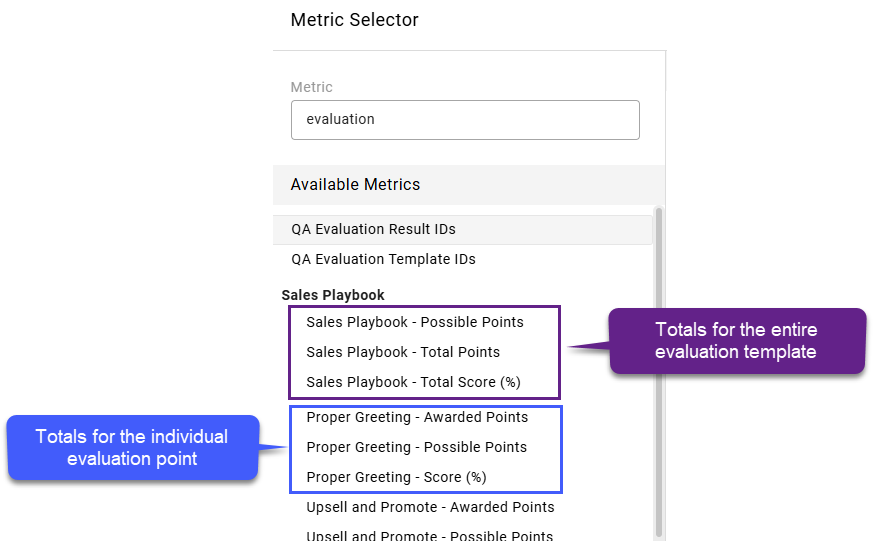
In the supplied "Metric" search box, type "Evaluation" to filter to evaluation-based metrics:
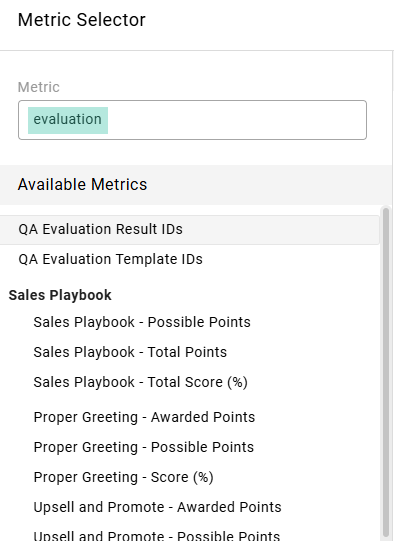
Any created evaluation template (that has not been archived) will be visible in bold text. See the "Sales Playbook" example above.
Beneath the template name, you'll find metrics available for that template.
First you'll see totals for the template itself.
For example, Sales Playbook (Evaluation Template Name) - Total Points
You'll also find individual evaluation point results.
For example, Proper Greeting (Evaluation Point Name) - Total Points
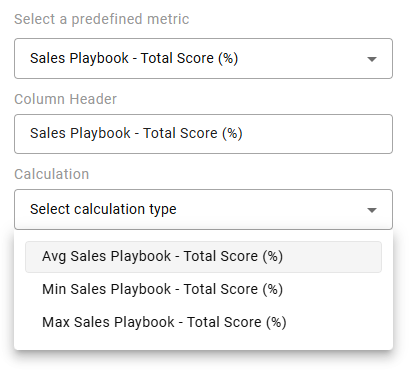
Once a metric is selected, you'll be able to further define the metric outcome with defining the calculation method and optional customized criteria.
For example, are you interested in the Average score, the highest recorded (Max) score, or the lowest recorded (Min) score? The most popular is Average.
Select "Add Column" once you've configured the column metric to your taste. You may limit your report to showing evaluation totals for the whole of the evaluation and/or you can add additional columns to break down the results of each evaluation point.
You may add additional columns at this time or move onto the summary.
Reporting Best PracticesIt is recommended you build the report to include the Total Points, Total Possible Points, and Total Score (%) for the Evaluation Template as a whole. You can also build columns with the Total Score % for each individual Evaluation Point. If you need a more detailed picture for each point, you'll need to add a Total Points and a Total Possible column for each Evaluation Point as well.
Select "Next" if you are done adding columns to the report.
Remaining Steps
The remaining steps do not vary much from building any custom report. Options will include:
- Defining Summary Metrics: Summarize columns in the report with totals and/or averages at the top of the report. This would be a great place to get an average score for all evaluations included in the report.
- Report Title: Name the report something that clearly identifies which QA evaluation is being used to compile the data used in the report.
- Sorting: By default, the report will be sorted chronologically or alphabetically depending on the report type. If you'd prefer to sort by evaluation scores, you may select the column you'd like to sort by as well as an ascending or descending order.
- Charts: These are optional but allow you to create visual aids to show trends for skills/agents/etc
Save your Report when finished
Updated 3 months ago