
Troubleshooting CCAC
Diagnoses common CCAC problems and captures the HAR file and console logs Xima Support needs for anything else.
Most CCAC issues fall into one known cause below. For anything else, Xima Support needs a HAR file and console log to diagnose it.
CCAC Logs Out Automatically
CCAC Logs Out AutomaticallyAn agent may be logged out of CCAC unexpectedly, typically when the browser tab is minimized or backgrounded. Modern browsers include memory-saving features — Chrome's Memory Saver, Firefox's Tab Unloading, Edge's Sleeping Tabs — that sever the CCAC connection when treated as a background process. Disabling the relevant feature, or adding the CCAC URL to its exception list, resolves the issue. Running CCAC through the Electron App instead of a browser tab avoids this altogether.
Generating a HAR File
A HAR (HTTP Archive) file records the network requests a browser makes and is one of the first things Xima Support asks for when a CCAC issue isn't explained by the logout behavior above.
HAR Files Can Contain Sensitive DataA HAR file includes the content of cookies and the pages loaded during the recording. Anyone with access to the file can see that data, so it should be shared only with Xima Support rather than posted somewhere public.
Chrome
-
Open Chrome to the page where the issue occurs
-
Select the
⋮menu, thenMore Tools > Developer Tools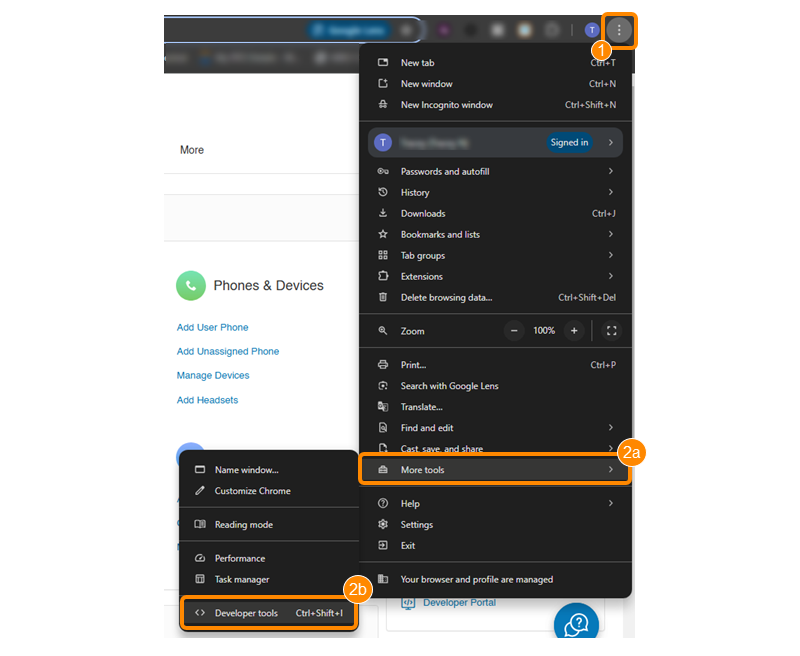
-
Select the
Networktab -
Confirm the record button (round icon, top-left of the panel) is red — select it if it's grey to start recording
-
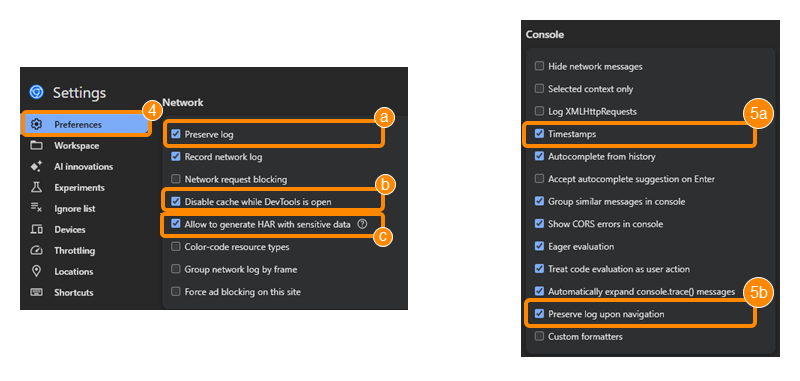
Check
Preserve Log-
It is best to add additional settings to ensure persistent logging
-
-
Select the crossed-circle icon to clear any existing logs
-
Reproduce the issue
-
Select
Export HAR, thenSave as HAR with Content
Firefox
-
Open Firefox to the page where the issue occurs
-
Open the Network Monitor (
Tools > Web Developer > Network)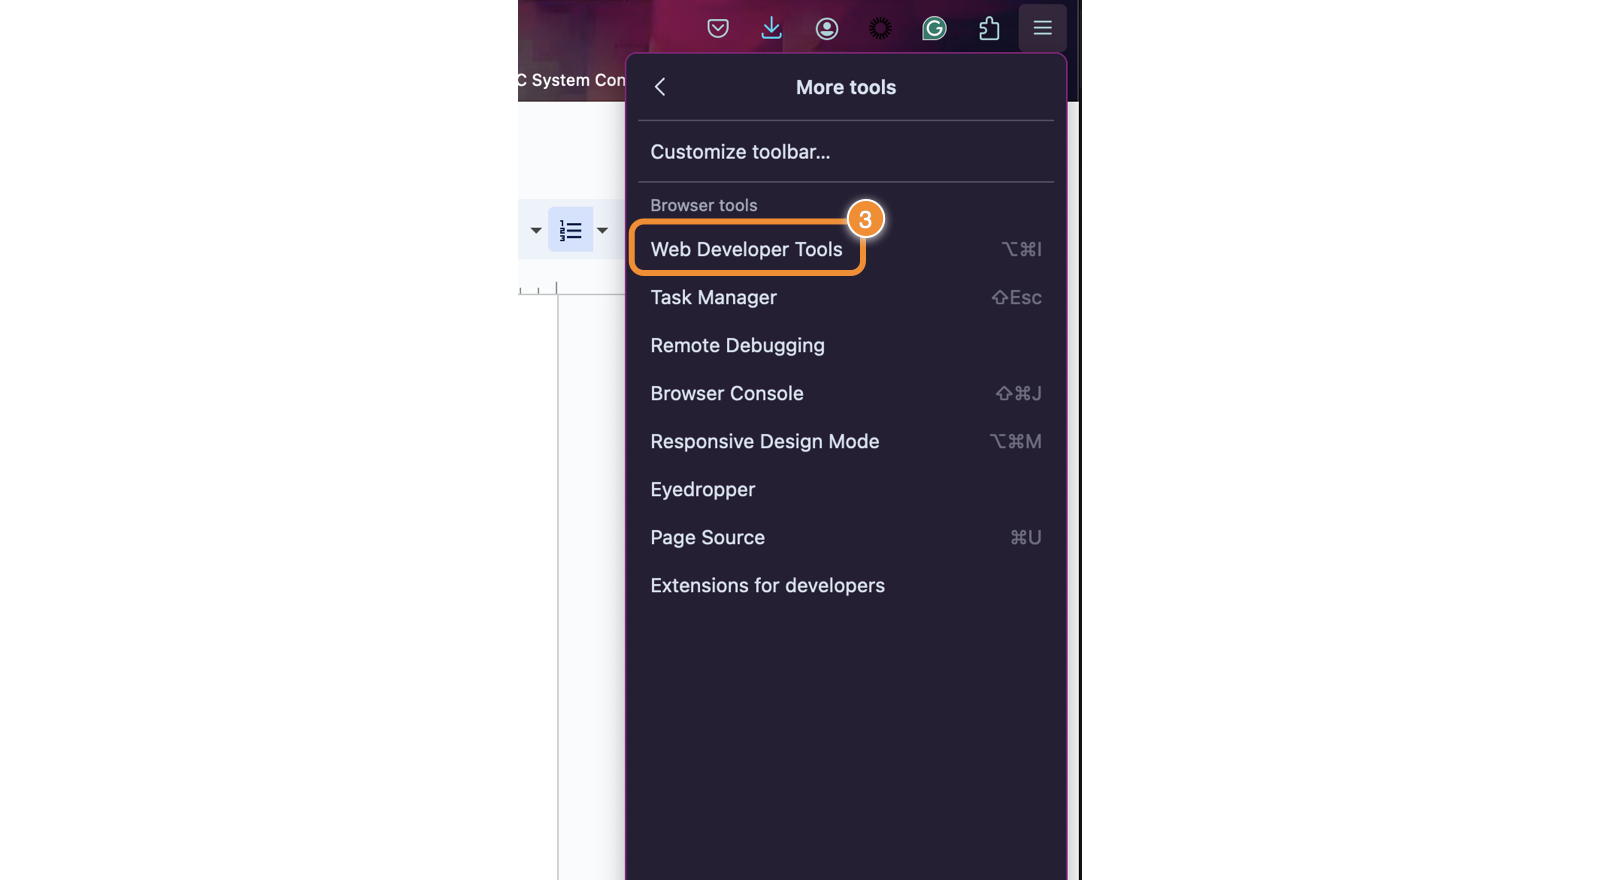
-
Reproduce the issue
-
Right-click any request in the
Filecolumn and selectSave All As HAR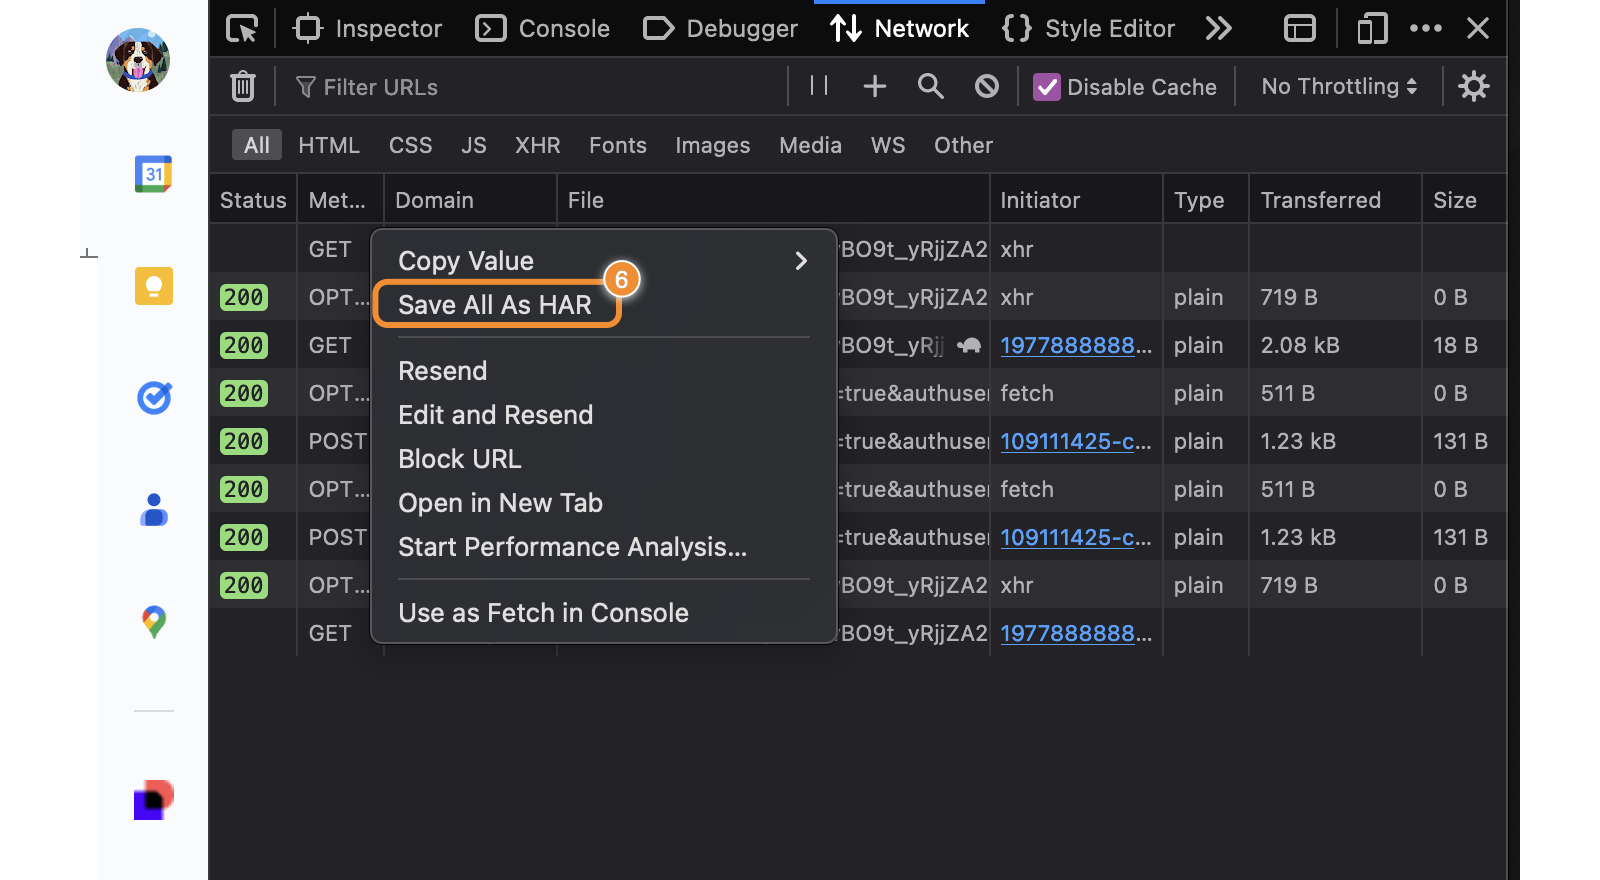
Safari
- Open Safari's
Developmenu — if it isn't visible, it needs to be enabled first from Safari's Advanced preferences - Select
Show Web Inspector, then theNetworktab - Reproduce the issue
- Select the
Exporticon and save the HAR file
Capturing Console Logs
Console logs are captured the same way regardless of browser: open the browser's developer tools, select the Console tab, reproduce the issue, and screenshot any errors shown.
| Browser | Reaching the Console |
|---|---|
| Chrome | Main menu > More Tools > Developer Tools > Console tab |
| Firefox | Tools menu > Web Developer — console logs open in their own window |
| Safari | Advanced preferences > Show Developer menu in menu bar, then Develop > Show Error Console from the menu bar |
Sending the File to Support
- The HAR file should be renamed before sending — it's named after the page URL by default, and a filename that looks like a URL is often flagged by spam or phishing filters
- The file should be compressed (zipped) before attaching, since an uncompressed HAR file frequently exceeds a support ticket's attachment size limit
Updated 2 months ago