
Widgets
Widgets are the individual visual components used to display real-time data on a wallboard. Each widget represents a specific metric or status indicator, such as the number of active calls, calls waiting in queue, longest wait time, or agent availability.
Widgets can be configured to pull live data from selected queues, skills, or agent groups. Once added, widgets can be resized and repositioned to create layouts optimized for large screens or supervisory monitoring.
Optional thresholds can be applied to widgets to visually indicate performance conditions using color changes, allowing issues such as excessive wait times or high queue volume to be identified at a glance.
Widgets update automatically as activity changes and are designed for continuous display without requiring manual refreshes.
Why are the widgets grayed-out?Widgets are grayed out when the canvas has no remaining grid space available for insertion.
Active Calls
Displays active calls by agent or skill. Up to 5 active calls are shown by default.
Configurable by Call Direction and Call Event Type.
Agent Box
Displays a selected agent's current state and the skills they are logged into.
Chart
Displays metric data for Agent, Account Code, Call Direction, Group, or Skill as a chart. Defaults to a Bar Chart.
Available chart types: Area Chart, Bar Chart, Horizontal Chart, Horizontal Stacked Bar, Line Chart, Stacked Area, or Stacked Bar.
Gauge
Displays a single metric as a gauge, showing its value relative to a configured minimum and maximum.
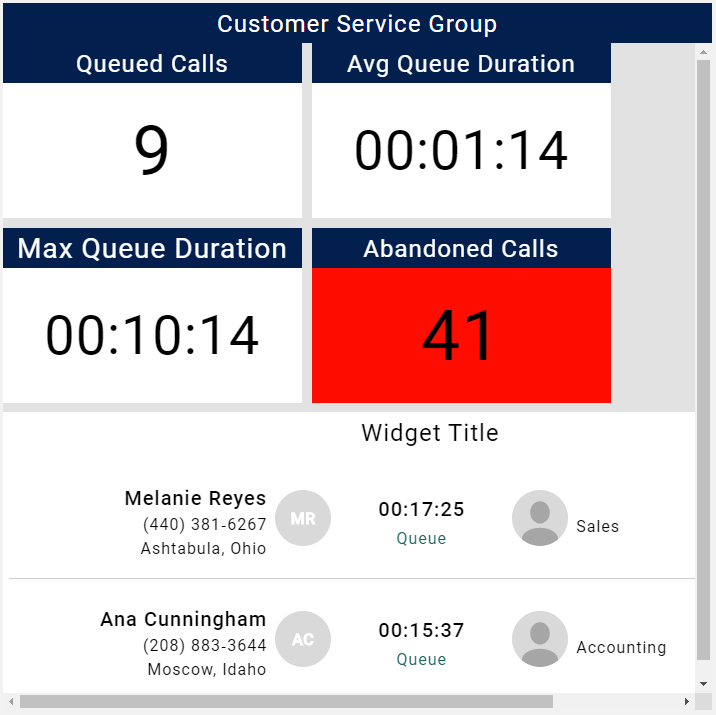
Group Box
Displays a selected group's information, including number of members, calls in queue, maximum queue duration, and average queue duration.
Image
Displays an image uploaded from a file.
Leaderboard
Displays a performance ranking for Agent, Account Code, Call Direction, Group, or Skill, customized by metrics
Line
Displays a single divider line. Defaults to Horizontal.
Orientation can be set to Horizontal or Vertical.
Marquee
Displays scrolling text incorporating live metric values, moving from right to left.
Pie Chart
Displays metric data for Agent, Account Code, Call Direction, Group, or Skill as a pie chart.
Text
Displays static text incorporating live metric values
Title Value
Displays a single metric as a large value.
Web Page
Displays an external URL as an embedded web page within the wallboard.
Not all URLs are guaranteed to load within this widget. Some external sites block iframe embedding.
Widget Group
Groups multiple widgets together into a single container widget.
Updated 26 days ago