
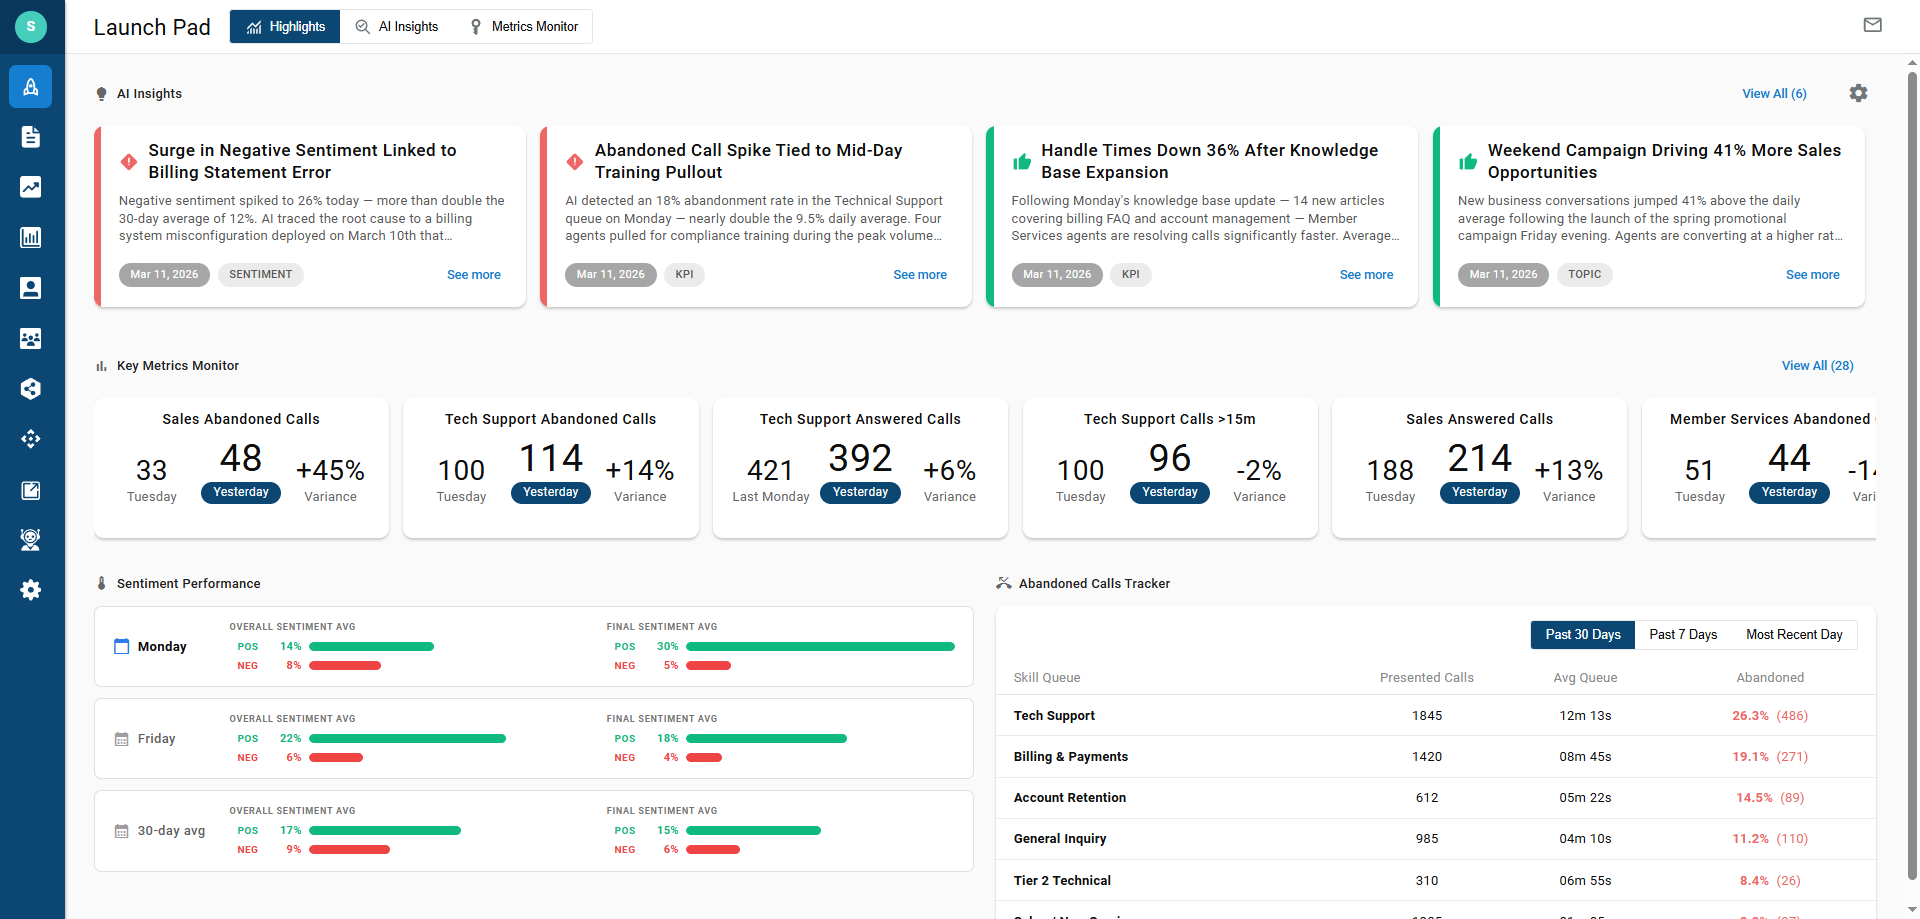
Launch Pad - Overview
Elite Licenses Required
Description
The Launch Pad for CCaaS Managers and Admins serves as a hub to cleanly see the trends of your contact center with a view of recent day's activity and comparing to 7 day and 30 day windows. It is not a replacement for Realtime Wallboards. Unlike wallboards, it focuses on the trends over the last 30 days rather than live activity.
Navigation
The launch pad will be visible upon logging into CCaaS but can be reopened by selecting the rocket icon at the top of the navigation bar.
Once on the launch pad, you'll see the Highlights on screen first. This displays the most notable AI Insight widgets, Monitored Metrics, Sentiment Performance, and the Abandoned Calls Tracker.
Selecting AI Insights in the top navigation menu will show the full list of AI Insight results that may not have made the highlight page.
Selecting Metrics Monitor will display the full list of Key Metric widgets that have been configured.
AI Insights
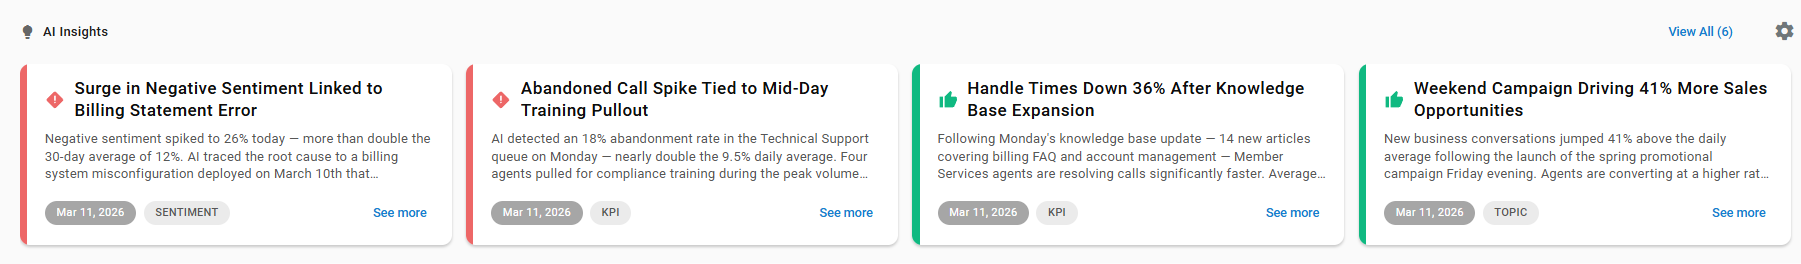
The top row of the launch pad is dedicated to AI Insights as obtained by the AI bots analyzing your contact center data overnight. The bots will identify concerning, good, or notable trends in the data. The bots then investigate anomalies by analyzing associated metrics for contributing factors, ultimately providing a conclusion and suggestions where applicable.
You'll be able to review the investigation path and findings for each insight by selecting "See more" on the tile.
Insights are sorted by priority: Concerning, then Good, then Notable. To see all insights for the given day and previous days (up to 7 days ago), select the "View All" link or the AI Insights tab at the top of the screen.
To learn more about AI Insights, review the article below.
Understanding AI Insights and how to modify or share insights.
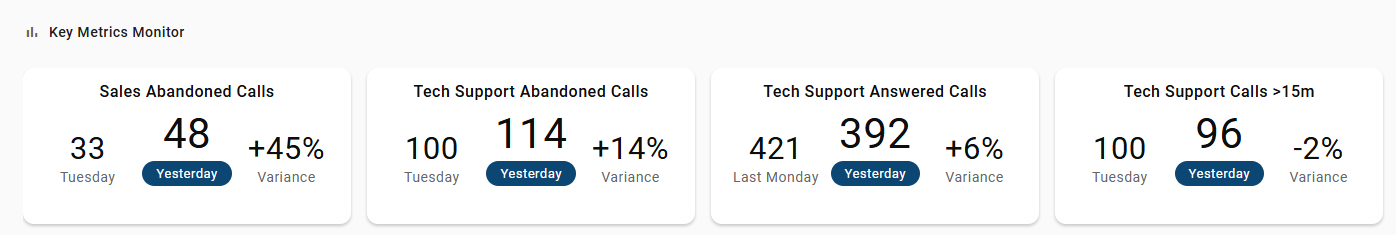
Key Metrics Monitor

Key Metric widgets are designed to show you the results of the most recently completed day of operation (e.g., yesterday), compares it against the desired timeframe and shows the resulting variance between the two.
Metrics on the highlights page are sorted by the biggest variance first. You can scroll horizontally to see more or by selecting "View All" or the Metrics Monitor tab at the top of the screen to see all configured metric widgets.
To learn more about Metric Monitors and how to configure them, see the article below.
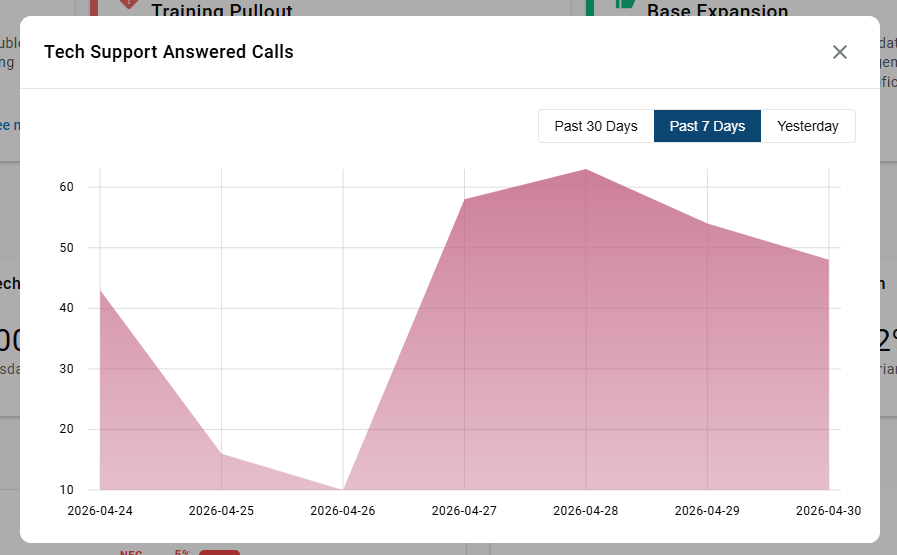
Graph View
Click on any Metric Monitor widget to see a chart of the given metric over 3 different timeframes.
Sentiment Performance
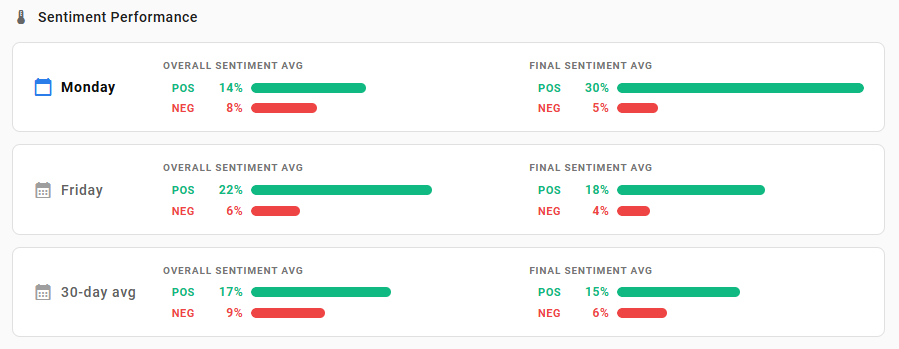
The Sentiment Performance widget displays how the recent work day's sentiment averages compare to the previous workday and the 30 day average.
The graphic bar maxes out at 30%, though it supports higher values. Sentiment values rarely average out with high percentages.
Abandoned Calls Tracker
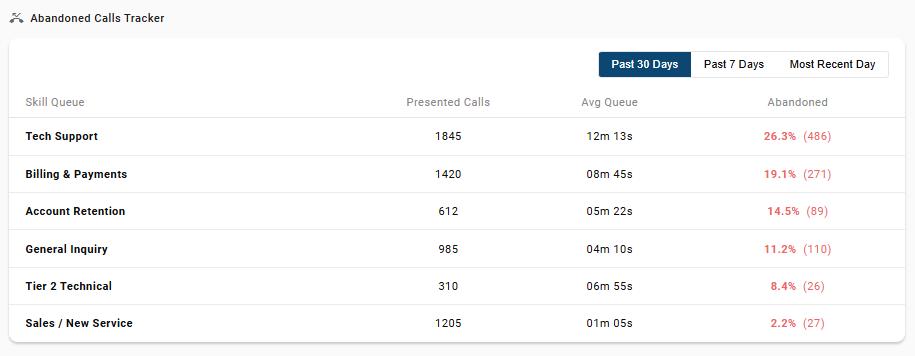
This widget sorts monitored skill groups by abandonment rate, highlighting the highest in red.. It also displays relevant columns for Presented Call Counts and Avg Queue Times so the reviewing manager has context for the queue volume.
You'll also be able to filter between the recent work day, 7 day average, and 30 day average.
Updated 3 months ago